
The U.S. reduction of the federal corporate tax rate from 37% to 21% starting in 2018, paired with new federal tax rules,1 are accelerating plans for automation and modernization in U.S. factories by giving manufacturers incentive to buy new machinery and boost productivity. Currently through 2022, the revised tax code allows companies to deduct 100% of the cost of equipment purchases from their taxable income in the first year. Previously, companies were only allowed to write off a portion of the equipment cost in the first year and the balance over subsequent years.2
These corporate tax changes are encouraging manufacturers to install more automation and replace aging machines sooner than originally planned. Many manufacturers have already increased their capital spending plans for 2018 and beyond. As a result, companies are re-evaluating their return on investment (ROI) policy on new equipment and payback timing.
Payback Timing and ROI
Payback timing, sometimes called payback period, refers to the number of years it takes to pay back the initial investment of new equipment from the ROI or cash flow that the project saves or produces. Historically, most companies set a maximum cut-off payback period of 2-3 years, depending on their business. In other words, if the payback calculation is one year, then the firm would purchase the new equipment. If the payback is over three years, it would not. The new tax incentives are giving companies good reason to re-evaluate and reduce their normal payback period.
ROI calculations have been used for many years, with accounting departments having established guidelines for their business model. Most ROI calculations focus on additional savings or cash flow from the following areas:
- Increased production rates
- Reduced labor and maintenance costs
- Improved product filling accuracy
- Improved product quality and product appearance
- Improved equipment changeovers and uptime (overall equipment effectiveness)
- Reduced scrap
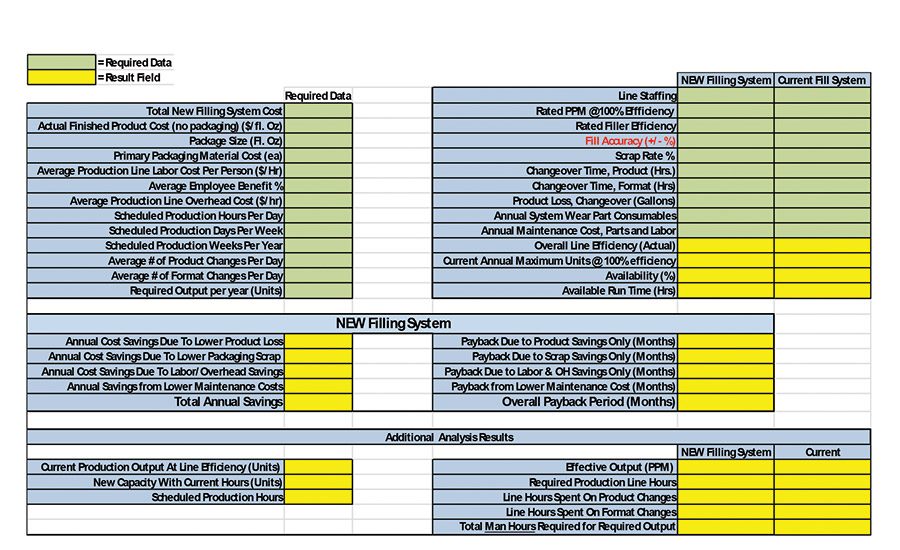
Figure 1 shows an example worksheet the data required and results generated for a typical filling system ROI and payback period calculation.
Filling Accuracy
One of the most underrated and miscalculated factors in production is filling accuracy and its significant impact on ROI and annual savings. High-viscosity materials such as sealants and adhesives can be difficult to pump, fill/dose accurately, and maintain repeatability due to their unique rheological properties and flow characteristics. The accuracy and repeatability of any new filling system is dependent on the type of product metering or dosing system selected.
Several types of filling/dosing systems are available to package product into a container:
- Time/pressure filling relies on consistent pressure and fill time to deliver a specific volume
- Auger filling uses a rotating auger, or screw; the number of revolutions determines volume
- Net weight filling features a weigh scale that controls the flow of product into the container
- Volumetric filling uses a metering cylinder and piston to premeasure a volume and dose the product into the container
Each type of system has it pros and cons. The proper choice for maximizing fill accuracy and repeatability requires evaluating the product, container, fill volume, fill profile, and production speed desired.
The most common choice for filling adhesives and sealants into containers of less than 1 gal (128 oz) is the volumetric system. Some volumetric systems can be pressure-fed with product, are easily adjusted for different containers, and can deliver repeatable accuracies of less than 1% of the fill volume.
Many companies will overfill their containers to ensure the customer receives no less than the volume (or weight) listed on the label. How much the company overfills can be dependent on their filling system accuracy and repeatability. If the filling system has poor accuracy (a wide fill range), the company must then overfill by a higher percentage. The proper dosing system, with excellent fill accuracy for the application, can deliver significant savings.
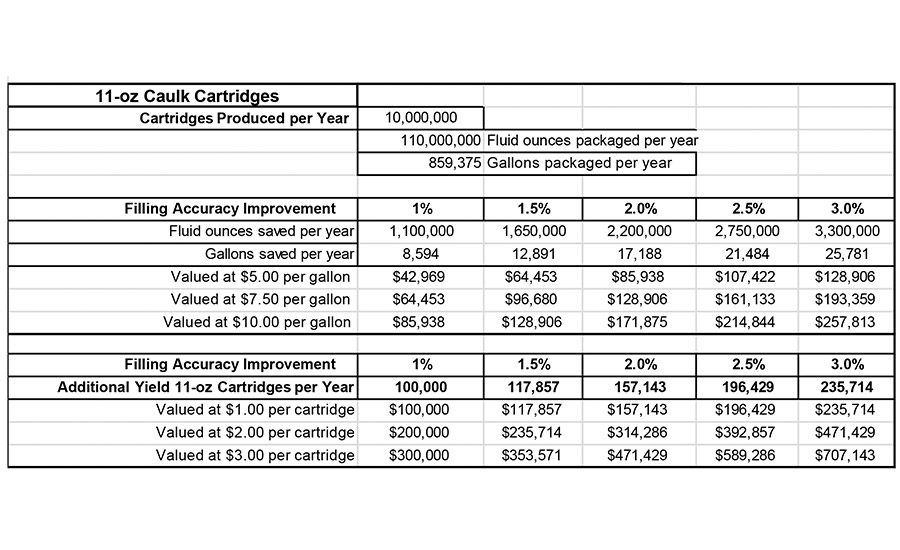
The accuracy savings example chart in Table 1 is calculated using the following criteria:
- 11-oz caulk cartridge production=10 million units per year (40/min or 4,200/day)
- Fill accuracy improvement=1%, 1.5%, 2%, 2.5% or 3%
- Product cost per gal=$5, $7.50 or $10
- Additional yield revenue=$1, $2 or $3 per cartridge
The Table 1 example offers two different calculations. The first section is volume of product saved per year (fluid oz and gal) based on an accuracy improvement range of 1-3% and listed by product cost of $5, $7.50, or $10 per gal. For example, an accuracy improvement of 2% will result in 17,188 gal saved and valued at between $85,938 and $171,875 per year.
The second section shows the additional yield of 11-oz cartridges if the product volume that is saved from the first section is packaged for sale (based on a per-cartridge value of $1, $2 or $3). For example, an accuracy improvement of 2% will result in 157,143 additional cartridge production—delivering revenue of $157,143-$471,429 per year. Your company's numbers can be adjusted to actual product and production parameters to calculate specific businesses’ potential savings.
The Time is Right
The current economic climate is offering new tax incentives, a tight labor market, and excellent ROI and payback periods. This may be the perfect time to improve production operations with high-accuracy filling equipment and new automation. ASI
For more information, email info@prosysfill.com or visit www.prosysfill.com.
References
1. Tangel, A. and McGroarty, P., “Tax Incentives Put More Robots on Factory Floors,” The Wall Street Journal, January 26, 2018, www.wsj.com/articles/tax-incentive-puts-more-robots-on-factory-floors-1516962600.
2. Francis, T.; Loftus, P.; and Haddon, H., “The Tax Law, Just One Month Old, Is Roaring Through U.S. Companies,” The Wall Street Journal, January 26, 2018, www.wsj.com/articles/the-tax-law-just-one-month-old-is-roaring-through-u-s-companies-1516899466.


