Using Rheology to Formulate Sealants
The insights gained from rheology can significantly accelerate sealant development and drive product differentiation.


Through quantitative measurements of sealant structure and flow behavior, rheology helps formulators understand the relationship between formulation components and their impact on application properties. This article demonstrates the link between raw material variables and the rheological and application properties of formulated sealants, beginning with a brief introduction to rheological terms relevant to sealants.
Experimental formulation components studied include pigment-to-binder ratio, surfactant loading, volatile oil amount and rheological modifier amount. The insights gained from rheology significantly accelerate sealant development and drive product differentiation.
Conventional Tests
Sealants are typically formulated with reference to ASTM standards C920 or C834. Although commercial products must meet these industry standards, critical disconnects exist between the measurements required to meet these standards and the desired customer experience.
Sealant development begins with formulation; the polymer and other components must be assembled in a way that gives the product the desired consistency. The next step is application, which includes dispensing the sealant out of a tube under pressure and tooling the sealant into the joint. Lastly, the sealant must dry in a reasonable timeframe and exhibit the desired cured properties; it must be flexible, with good adhesion and cohesion, and have the desired appearance. Traditionally, the sealant development process has been iterative and based on experience and trial and error.
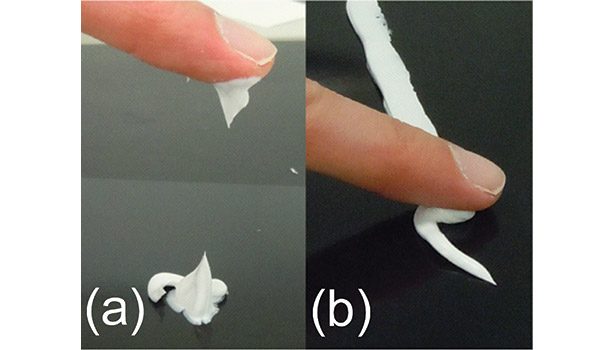
Conventional tests for wet sealants include tooling-tapping and tooling-sliding. For tooling-tapping, as shown in Figure 1a, a sample of sealant is applied to a flat surface, and a finger is tapped on the sample to simulate engaging and disengaging the tool or the finger used to press a sealant into a joint. A value of 1 to 3 is assigned, with 1 giving no peak, and 3 giving a large peak upon removal of the finger. For tooling-sliding, as shown in Figure 1b, a bead of sealant is applied to a flat surface. Both the ease with which a finger can slide and the amount of residual sealant tail left following fast removal of the finger at the end of the bead are assessed. A value of 1 to 3 is assigned, with 1 being the least residual sealant tail and 3 being the most residual sealant tail.
The conventional tests can be subjective, especially those relying on the use of a finger. For people with a significant amount of sealant experience, a finger-type approach may be acceptable. Much more helpful, however, are objective and quantitative measures of sealant material properties, which can be measured using rheology—specifically oscillatory rheology.
Rheology Testing
Oscillatory rheology provides quantification of the liquid and elastic character of a material. This quantification is accomplished by applying a sinusoidal strain and measuring the resulting stress. G’ and G’’ are the responses that are in and out of phase with the applied strain, respectively. G’ provides a measure of the elastic or structural character of a sample, while G’’ quantifies the liquid character.
Real-world examples help illustrate the meanings of G’ and G’’. For example, water is at the liquid end of the spectrum. Water is completely fluid; if it is sheared, it deforms and the energy applied to shear it is dissipated. Water can be completely characterized by G’’.
On the other hand, if a rubber band is stretched within a certain amount of force, it remains deformed as long as it is being stretched. G’ captures the elastic character of the rubber band. Many materials have properties between those of water and rubber; these materials are viscoelastic. Sealants fall into this category. The relative magnitudes of G’ and G’’ provide information regarding the overall behavior of the sealant. Rheology is a powerful tool that links customer application experience to measurable material properties. Target parameters measured via rheology can be used to accelerate product development.
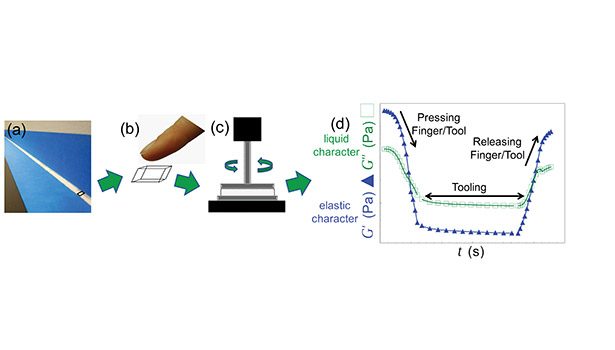
An oscillatory rheology procedure was used to simulate tooling a sealant, as illustrated in Figure 2. The procedure was adapted from Mezger.1 An element of sealant in a real-world application undergoing tooling can be represented by a sample of sealant in the rheometer, which simulates tooling the sealant and provides quantification of sealant properties. The graph in Figure 2d shows moduli, elastic character and liquid character, as a function of time and force during the tooling process. At the beginning of the test, when the finger or tool is engaging the sample, the sealant character is dominated by the elastic structure, evidenced by G’ > G’’. Moving forward in time and proceeding with the tooling process, more force is applied. The structure starts to break down and the sealant flows into the joint, shown by G’’ > G’. When the tool/finger is removed, along with the accompanying force, the structure (G’) rebuilds.
The Pressing Finger/Tool portion of the graph in Figure 2d captures the beginning of the tooling process. The force at which the moduli are equal (G’ = G’’, also known as a crossover point) is related to the tooling-tapping assessment. G’ is decreasing during the Pressing Finger/Tool portion of the tooling process. A decrease in G’ can increase a sealant’s tendency to wet and adhere to a finger or tool, leading to the undesirable peaks characteristic of the sealant ranked poorest in the tooling-tapping assessment. To improve the tooling-tapping (i.e., decrease the tendency to form peaks), the rheological signature of moduli crossover needs to be shifted to longer time and higher strain.
The Tooling portion of the graph in Figure 2d captures moving the tool or finger along the sealant during the tooling process. Again, the sealant is flowing during this time, as indicated by G’’ > G’. Decreasing the change in complex viscosity or consistency of the sealant, which is related to G’ and G’’, improves the ease with which the sealant can be tooled, because it takes less force to move the sealant. In other words, the faster a steady state is reached where the response and properties of the sealant aren’t changing, the easier/better the tooling of the sealant. This type of quantification is not possible with a finger.
The Releasing Finger/Tool portion of Figure 2d captures the end of the tooling process. The sealant rebuilds its structure during this portion of the process, as evidenced by the increase in G’ above G’’. This crossover between G’ and G’’ is related to tooling-sliding. Tooling-sliding is improved by moving the crossover to higher forces, allowing structure rebuild quickly after tooling.
Formulation Influences
A design of experiments was used to understand the influence of formulation components on wet sealant properties and performance during the tooling process. Levels of surfactant, volatile oil and thickener, as well as the pigment-to-binder ratio (P:B), were studied. By using a design of experiments, the influences of these factors were studied simultaneously.
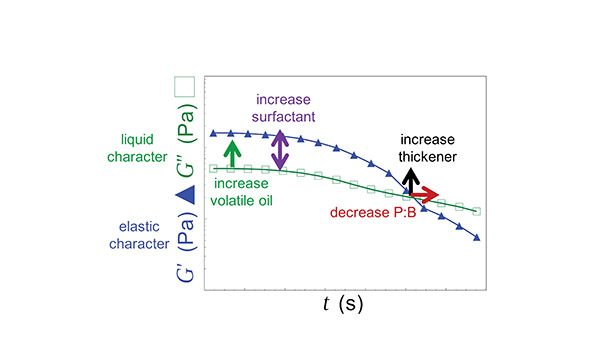
Adjusting the levels of these factors directly influenced the rheology of the sealant. The influences of these factors on the Pressing Finger/Tool portion of Figure 2d are shown in Figure 3. Increasing the volatile oil amount resulted in an increase in the liquid character in the linear region, as indicated in Figure 3, while increasing the surfactant increased the difference between the elastic and liquid character in the linear region. Decreasing P:B moves the modulus crossover point to longer times and higher applied strain, and increasing thickener increases the modulus value where this crossover occurs. Understanding how differences in formulations impact end-product rheology helps to tailor sealants to give the desired consistency and performance.
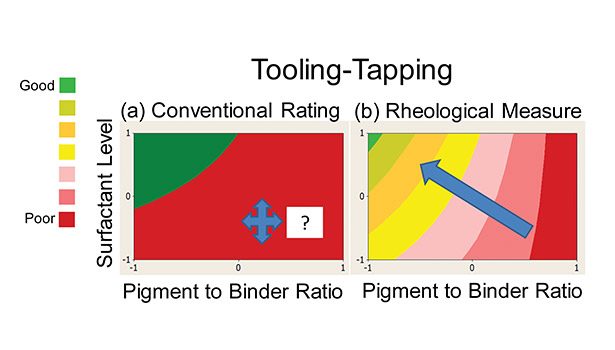
Specific examples show how rheology provides more resolution and directionality than conventional tests. For example, the tooling-tapping metric can be compared to the rheological measure of the first moduli crossover for the ranges of P:B and surfactant (see Figure 4). The conventional rating method provides the general direction that increasing surfactant level and decreasing P:B improves tooling-tapping, but the potential extent of improvement is not apparent. The rheological metric of moduli crossover, however, provides more information regarding how adjusting the P:B and surfactant levels can improve the tooling-tapping of the sealant formula.
Figure 5 shows a second example, with the conventional rating of tooling-sliding and the rheological measure of G’’ in the linear region for the ranges of thickener and volatile oil levels. In this case, the conventional testing gives no directional information regarding how to improve tooling-sliding, whereas the rheological approach clearly indicates increasing both thickener and volatile oil levels will improve tooling-sliding. Quantitative and physically meaningful rheology data can provide information critical to formulating a sealant with the optimized properties and an improved consumer experience.
A Powerful Tool
Rheology provides powerful insight for sealant design. In this article, rheology was used to simulate sealant tooling, and the rheological data was related to conventional tooling assessments. Rheology provided quantitative measurements of sealant structure and flow behavior and clearly demonstrated the influence of sealant component levels. Rheological parameters provided additional resolution and directionality for improving sealant tooling. Incorporating rheology into sealant design can dramatically accelerate product development.
For more information, contact the primary author at cstreet@eps-materials.com or visit www.eps-materials.com.
Reference
1. Mezger, Thomas G., “The Rheology Handbook,” European Coatings Tech Files.
Watch our interview with author Carrie Street!
Looking for a reprint of this article?
From high-res PDFs to custom plaques, order your copy today!


