Analyzing Polymer Properties
A monitoring system continuously analyzes polymer properties during production and in real time.
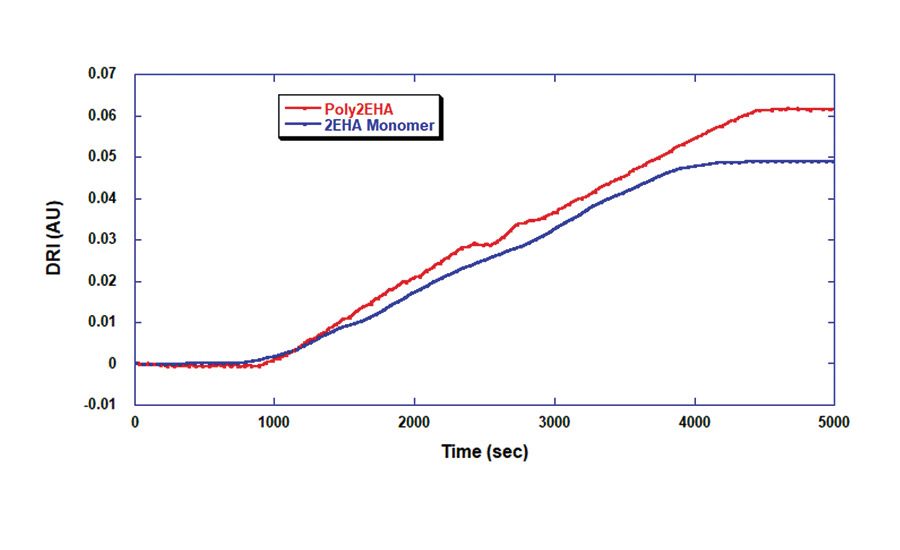
Figure 1. ACM RI data for 2EHA monomer and poly2EHA.
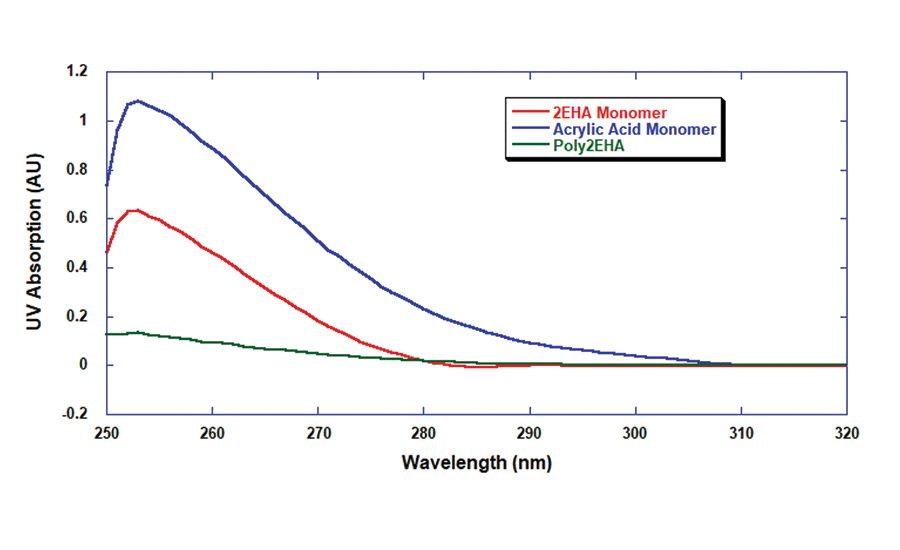
Figure 2. UV spectra of 2EHA, acrylic acid and poly2EHA.

Figure 3. Raw UV, viscosity and SLS signals of homopolymer 2EHA batch polymerization.
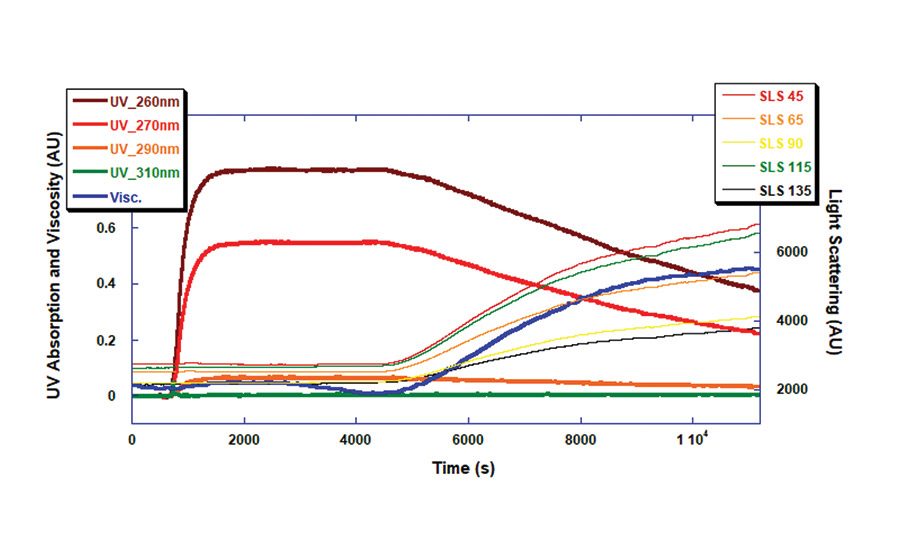
Figure 4. Raw UV, viscosity and SLS data from copolymer 2EHA and AA batch polymerization.
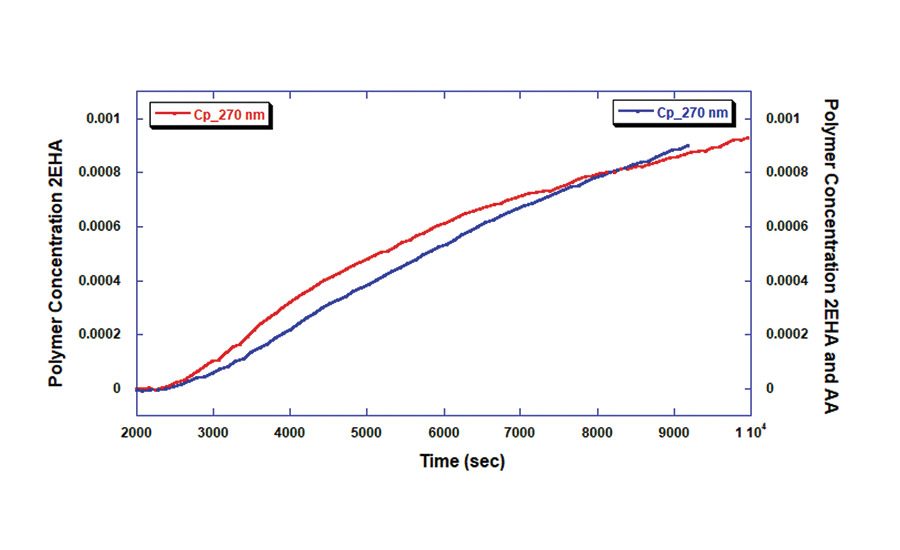
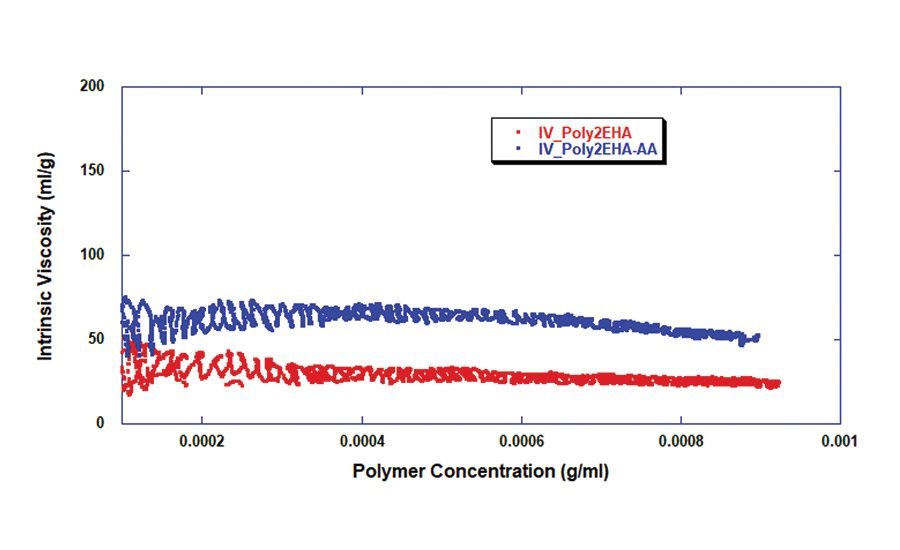
Figure 6. Intrinsic viscosity vs. polymer concentration.
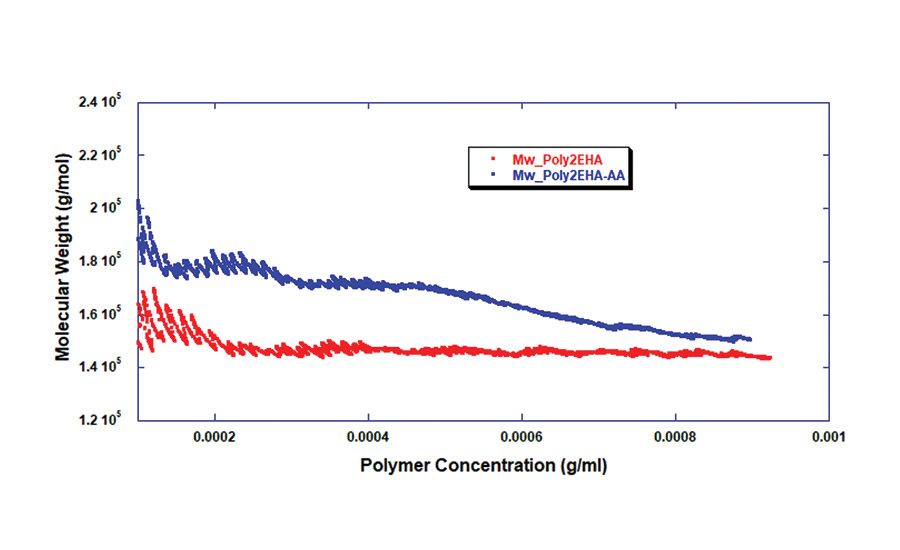
Figure 7. Molecular weight vs. polymer concentration.

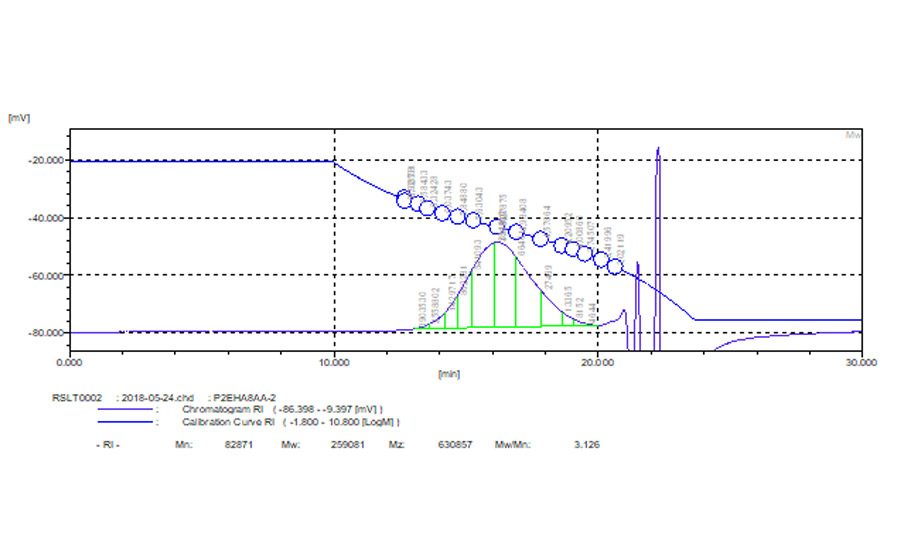
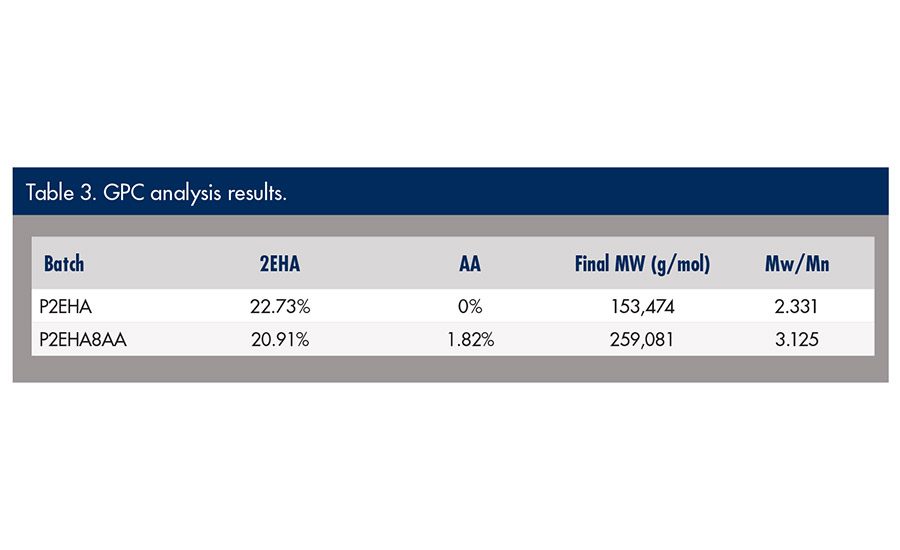
Figure 8. GPC analysis.



Pressure-sensitive adhesives (PSAs), which date back to the 1920s, are critical to the medical, engineering and construction industries. Demand for PSA tape in 2017 was 39.2 billion sq m4 and was expected to rise to 50 billion sq m by the end of 2018. PSA manufacturers continue research efforts to invent novel materials that are required to meet both customer demand and new applications.
The application quality of a PSA is determined by three main properties: tack, peel strength (adhesion) and shear strength (cohesion).1-2 Various blends of reactant monomers such as acrylic acid and 2-ethylhexyl acrylate (2EHA) have been introduced into reaction systems to tailor the physical properties of PSAs. The results of these chemistry and reactant changes are observed in the reaction kinetics, molecular weight (Mw), and intrinsic viscosity (IV), which vary by formulation. Conventional, off-line analysis on an end product makes manufacturing and QC complicated and time consuming, with a lack of systematic consistency. Introducing continuous, online monitoring of these characteristics leads to better quality and reaction process optimization, improving the R&D cycle and increasing manufacturing efficiency.
An online monitoring system has been developed that continuously analyzes polymer properties during production and in real time.* The system uses a well-known, non-chromatographic method to measure monomer and polymer concentration, intrinsic viscosity, and weight average molecular weight. Its automation and analysis software handles data acquisition, analysis, and reporting in real time.
*ACOMP
Understanding Optical Properties
Considering real-world reaction formulations for certain practical applications, various monomers might be copolymerized with 2EHA. Some of these include methyl methacrylate (MMA), cyclohexyl methacrylate (CHMA) and acrylic acid (AA). Among the select monomers of interest, acrylic acid is the most challenging because polyacrylic acid is insoluble in ethyl acetate; however, a certain degree of copolymerization between 2EHA and AA is soluble in this organic solvent.
According to the Zimm equation, the differential refractive index (dn/dc) of a material is imperative for Mw calculations. Both the monomer(s) and polymer(s) were characterized by automatic continuous mixing (ACM), a method by which a solute and solvent gradient is measured to determine dn/dc, virial coefficient (A2), and solubility. Figure 1 shows that for equal composition of pure monomer and polymer form of 2EHA, the polymer form exhibits a slightly higher voltage response from the differential refractometer.
According to these ACM results, the dn/dc of 2-ethylhexyl acrylate and its polymer are 0.106 and 0.134, respectively. It is noted that the dn/dc difference between monomer and polymer is quite small, which is demonstrated in the reaction data from the homopoly2EHA ACOMP reaction. In terms of the quantitative analysis of polymer concentration or monomer conversion, RI is not a preferable tool for this reaction system; however, it is still necessary to understand these values for an accurate Mw determination.
A UV-Vis batch spectrometer was used to investigate the absorption wavelength range applicable for the analysis of reaction conversion. The samples of monomer and polymer were prepared at 1 mg/mL in ethyl acetate. Above the UV-cutoff wavelength of ethyl acetate, which is 255 nm, Figure 2 shows that 2EHA has a strong absorption peak from 255 nm to approximately 287 nm. Conversely, acrylic acid has a broader peak up to 310 nm, with AA exhibiting a higher extinction coefficient than 2EHA. This means copolymer reactions can be quantitatively analyzed by UV in terms of the conversion and composition of each monomer on the premise that the mass ratio of 2EHA to acrylic acid is 1:1 (both conversion and composition of each monomer).
The UV range from 288 nm to 310 nm is useful when determining the conversion and concentration analysis of AA. Using the UV absorption range from 255 nm to 287 nm, the conversion and concentration of 2EHA can be solved.
Monitoring Synthesis
The system used a UV/Vis and a differential refractometer for measuring monomer and polymer concentrations. The UV/Vis uses four wavelengths, 260, 270, 290 and 310 nm, for measuring the absorption of monomer. A single capillary viscometer and a 5-angle light scattering were used for measuring intrinsic viscosity and weight average molecular weight, respectively.
The system extracted a sample from the reactor recirculation loop at the rate of 0.25 mL/min. Next, the reactor sample was diluted 150x with ethyl acetate, the same solvent used in the reactor to condition the polymer sample to necessary concentrations that reveal the desired polymer characteristics.
Reaction Methodology
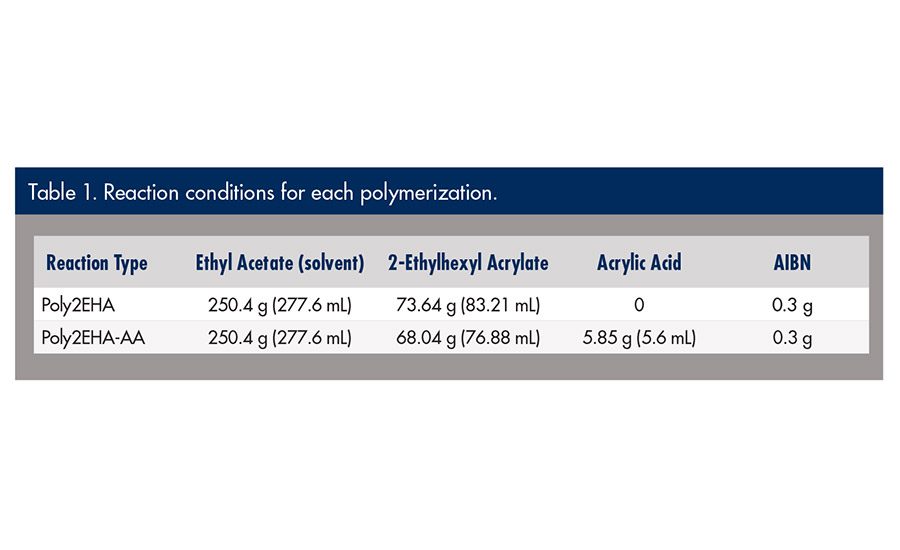
Two batch copolymerizations of 2-ethylhexyl acrylate (2EHA) homopolymerization and 2EHA/AA were conducted using ethyl acetate (EA) as a solvent at a constant temperature of 60˚C. The reactions started with 22.7% total monomer concentration by mass and 0.36% initiator (AIBN). The reactor contents were purged with nitrogen for 1 hr prior to the start of the polymerization.
The system successfully monitored the polymer properties under the following conditions:
- Raw UV/Vis at 260, 270, 290 and 310 nm, and
- Light scattering at 45°, 65°, 90°, 135° and 145°
Figure 3 shows raw signals vs. time. The four UV signals decrease in a first order exponential manner as the double bonds in the monomer break to form polymer. The viscosity and 5-angle light scattering signals increase with the polymerization as the molecular chains of the polymer increase in mass. Figure 4 displays raw signals from the 2EHA and AA copolymerization reaction vs. time.
The polymer concentrations shown in Figure 5 are measured using the UV/Vis detector at 270 nm. The polymer concentration increases proportionally as monomer concentration decreases and is equivalent to monomer conversion into polymer. The information derived from this conversion can present details about the reaction kinetics and reactivity of the monomers in both the homopolymer and copolymer reactions.
Figures 6 and 7 show the intrinsic viscosity and weight average molecular weight vs. polymer concentration. Note that in the copolymerization of poly2EHA-AA, both the Mw and viscosity begin at a higher value than that of only the homopolymerization of poly2EHA. Observable in the copolymerization is an abrupt change in the weight average molecular weight after the consumption of AA monomer. After this point in the reaction, there is no longer any AA to convert into the polymer chains; thus, the remainder of the polymerization produces homopolymer 2EHA.
GPC Characterization
In comparing this analysis method with that of standard characterization methods, the synthesized polymer end products were characterized by gel permeation chromatography (GPC). The GPC result for the homopolymer 2EHA is very close to that of the online monitoring system result. This means the proposed method of using the online system for monitoring polymerizations can provide an equivalent, real-time, online characterization of molecular weight.
The GPC result of copolymer 2EHA-AA, however, is significantly higher than the online analysis. This result is due to the early incorporation of AA to the poly2EHA, which increases the hydrodynamic volume of the molecules. This caused a higher GPC result than the real weight average molecular weight of the polymer, as directly measured by the online system. The polydispersity of the product also reflects the incorporation and then exhaustion of AA early in the polymerization that therefore results in an abundance of small chain 2EHA homopolymers.
Conclusion
The free radical polymerization of 2-ethlyhexyl acrylate and 2-ethylhexyl acrylate/acrylic acid reactions are easily monitored and analyzed by online monitoring. The results shown in Table 2 indicate that the addition of 8.7% acrylic acid does not significantly affect the weight average Mw of the final product once it is completely consumed, but it causes an overall 112% increase in intrinsic viscosity due to an increase of the hydrodynamic volume.
For more information, phone (504) 777-2805, email matt.willard@fluenceanalytics.com, or visit www.fluenceanalytics.com.
References
- Reed, W.F. “Automated Continuous Online Monitoring of Polymerization Reactions (ACOMP) and Related Techniques,” Encyclopedia of Analytical Chemistry, 2013, 1-40, DOI: 10.1002/9780470027318.a9288.
- Peykova, Yana, et al. “Adhesive properties of acrylate copolymers: Effect of the nature of the substrate and copolymer functionality,” International Journal of Adhesion and Adhesives, 2012(34), 107-116.
- Lester, Christopher L. and Bottorf, William L., “Acrylic Pressure Sensitive Adhesive Having Controlled Placement of Functional Group,” www.pstc.org.
- “A Brief History of Pressure-Sensitive Adhesives,” Tom Brown Inc. News, http://tombrowninc.com/blog/brief-history-pressure-sensitive-adhesives/4.
Looking for a reprint of this article?
From high-res PDFs to custom plaques, order your copy today!


